An Australian Financial Review article yesterday claimed that it was. So let’s use this as an example of how to look at news articles on financial matters—but from a financial planner’s viewpoint.
What the Article Says
The heart of the article is covered in the opening two paragraphs:
“A key valuation metric touted by legendary investor Warren Buffett is signalling that equities are relatively cheap, bolstering the case that the sizzling rebound in US stocks has room to run.
The “Warren Buffett Indicator” measures the ratio of the total value of the US stock market via the Wilshire 5000 Index divided by the dollar value of US gross domestic product. It stands at its lowest level since early September, even after a bounce that has sent stocks screaming higher in recent weeks.”
If you’re casually scanning the media, you’d likely come away thinking the US market has dropped enough that the globally-renowned Warren Buffett thinks it’s a great time to buy. But you’d be quite wrong.
Let’s Assume They’re Right
Let’s take the article at face value and assume it is a good time to buy US shares. The article goes on to quote a fund manager “who has been piling into big tech stocks.”
But—at what valuation are you buying those shares?
It’s easy to Google the Warren Buffett Indicator. A number of sites offer free, up-to-date charts (links below). To save you time, I’ve included one with this post. Please take a moment to look at that chart—and think about what the most recent movements really suggest about Buffett’s impression of US share valuations today.
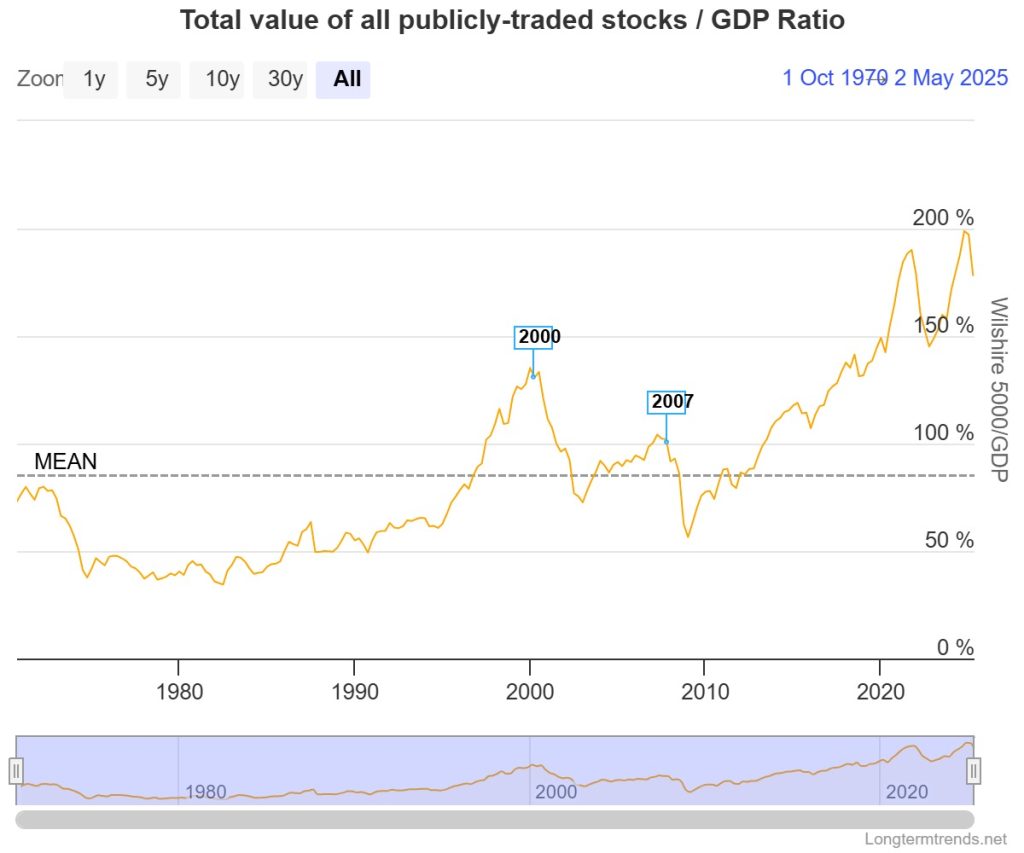
Yes, the Warren Buffett Indicator Has Fallen…
Yes—the Warren Buffett Indicator has dropped from around 205% earlier this year to 165% in early April. This reflected the market’s reaction to Donald Trump’s administration’s erratically-formulated tariffs on all trading partners.
This low-point was quickly erased as investors assumed the tariffs would be reconsidered, lifting share markets back to about 189%.
So yes, the AFR’s suggestion has a surface-level point: valuations are lower than they were a few months ago. You’re buying at prices roughly equivalent to September last year.
But are you armed with all the relevant facts? Is this a clever strategic decision—or are you punting?
Investment Intentions Matter
Your next step is to reflect on why you’re investing.
- Are you hoping to take advantage of a short-term dip?
- Are you adding to an existing US position?
- Is this part of a long-term strategy?
And what does “long term” actually mean for you? It’s a meaningless concept unless you attach a timeframe. Only by doing that do we start adding flesh to the skeleton of an investment idea.
Look at the Chart Again
Now, look again at the Buffett Indicator chart. Observe the long-term average. Where do current prices sit in relation to that average?
In March 2000, the Warren Buffett Indicator sat at around 138%. Not long after, an extended market drop began, reaching a low of 52% by March 2009. That’s nine years of negative to poor returns.
I’ve included a chart from Yahoo.com showing the S&P 500, Wilshire 5000, and NASDAQ from 2000 onward. These charts do not include dividends—which would help a little. But even so, an investor in 2000 didn’t see a return to their original capital value for somewhere between 12 and 16 years.
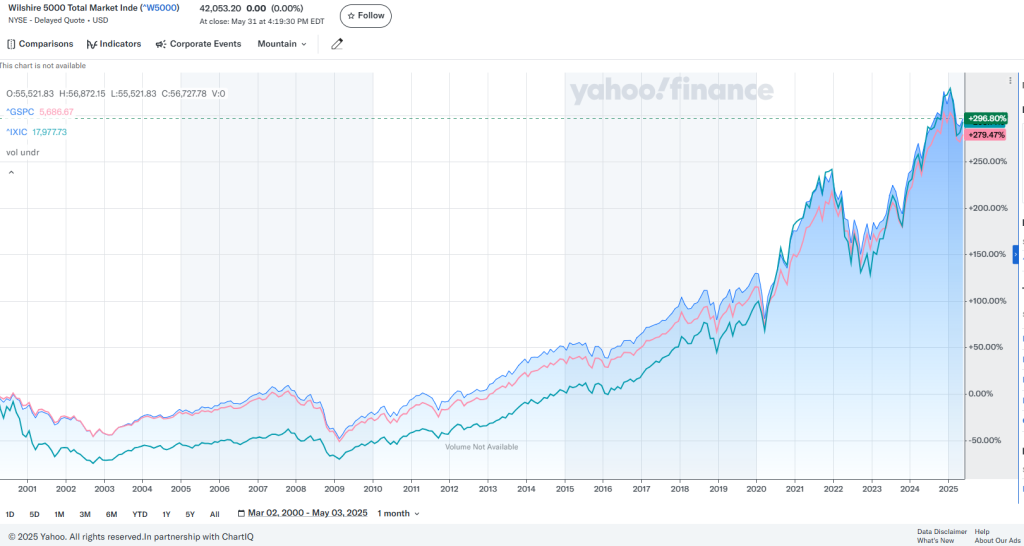
Dividends help—but capital matters, especially for people who may need to use their money.
Valuations Still Look Stretched
So yes, valuations have come down from recent peaks. But they are still higher than at any point in most longer-term market timeframes.
If you’re planning to access your capital within the next [insert your own timeline here], you should be concerned.
Trader or Investor?
From a financial planner’s viewpoint, the AFR article includes several references to “traders.” That is, people who buy and sell in the hope of making a profit.
But study after study shows that most investors do not beat the market. On average, they underperform simple index returns—especially when trading frequently.
So most investors who entered the US market in 2000, when the Buffett Indicator was at a high, lost money—or waited more than a decade just to get back to square one.
Today’s indicator is far higher than in 2000 or even just before the GFC in 2007. Does that sound like an obviously good time to invest?
What Is Buffett Himself Doing?
In 2024, Buffett reduced his fund’s exposure to Apple from 50% to 26%, helping Berkshire Hathaway accumulate a cash hoard of $325 billion.
Reuters: Buffett sells Apple, builds cash pile – November 2024
Berkshire has been a net seller of US shares for eight consecutive quarters. I can’t pretend to know Buffett’s mind, but it’s fair to assume that his own indicator played a role in that decision.
Still, Buffett remains heavily invested across US companies. He’s just chosen to have more cash on hand—presumably in case valuations drop further.
The Long-Term View
Buffett has famously held Coca-Cola shares since 1988. He reinvests income and rarely sells. You may not be in a position to do that.
You might need income. You might not be able to keep adding to your investments. In that case, market falls will feel sharper—and valuations will matter more.
Consider superannuation: if your employer contributes regularly, those inflows help smooth volatility. That’s part of why Australia has one of the largest private capital pools in the world.
But if you’re investing a lump sum and can’t top it up, you’ll notice the swings.
So—Buy, Hold, or Sell?
Is the Buffett Indicator screaming “Buy”? Or is it whispering “Hold”? Or muttering “Sell”?
There’s no simple answer. Markets can stay irrational longer than you can stay solvent. The US market may surge higher—or it may return to long-term average valuations.
The charts I’ve provided are price-only. Dividends do change the picture. And how you use those dividends—reinvest or draw down—will influence your outcome.
Ultimately, you must decide from your point of view. Broad indexes and generalisations aren’t personal. They may or may not be relevant to you.
A Planner’s Final Word
As always, please remember the Great Disclaimer—nothing in this post is personal financial advice. It is general in nature. Even if it seems like I’m speaking directly to your situation—I’m not.
If you want to know what to do (not just what you could do), please seek professional financial advice.
And feel free to ask questions. I’ll answer factually and generally—but advice? That takes a formal Statement of Advice, backed by research, documentation, and your personal goals.
Regards,
Michael