When you manage private wealth, you quickly learn to tune out the structural marketing hype and look for where systemic risk hides. Right now, global indices are treating the artificial intelligence boom as an unmitigated earnings miracle. But if you peer underneath the hood of the major U.S. listings, the ledger reveals areas where valuation assumptions and capital flows may be reinforcing one another in ways that deserve closer examination.
To give our clients and partners a clear way to see through the noise, we have built the Global Index “Air” Stress-Test Simulator. This interactive tool allows you to strip away the narrative layers of the market to see what happens to traditional equity benchmarks when capital is forced to prove its real-world return on investment.
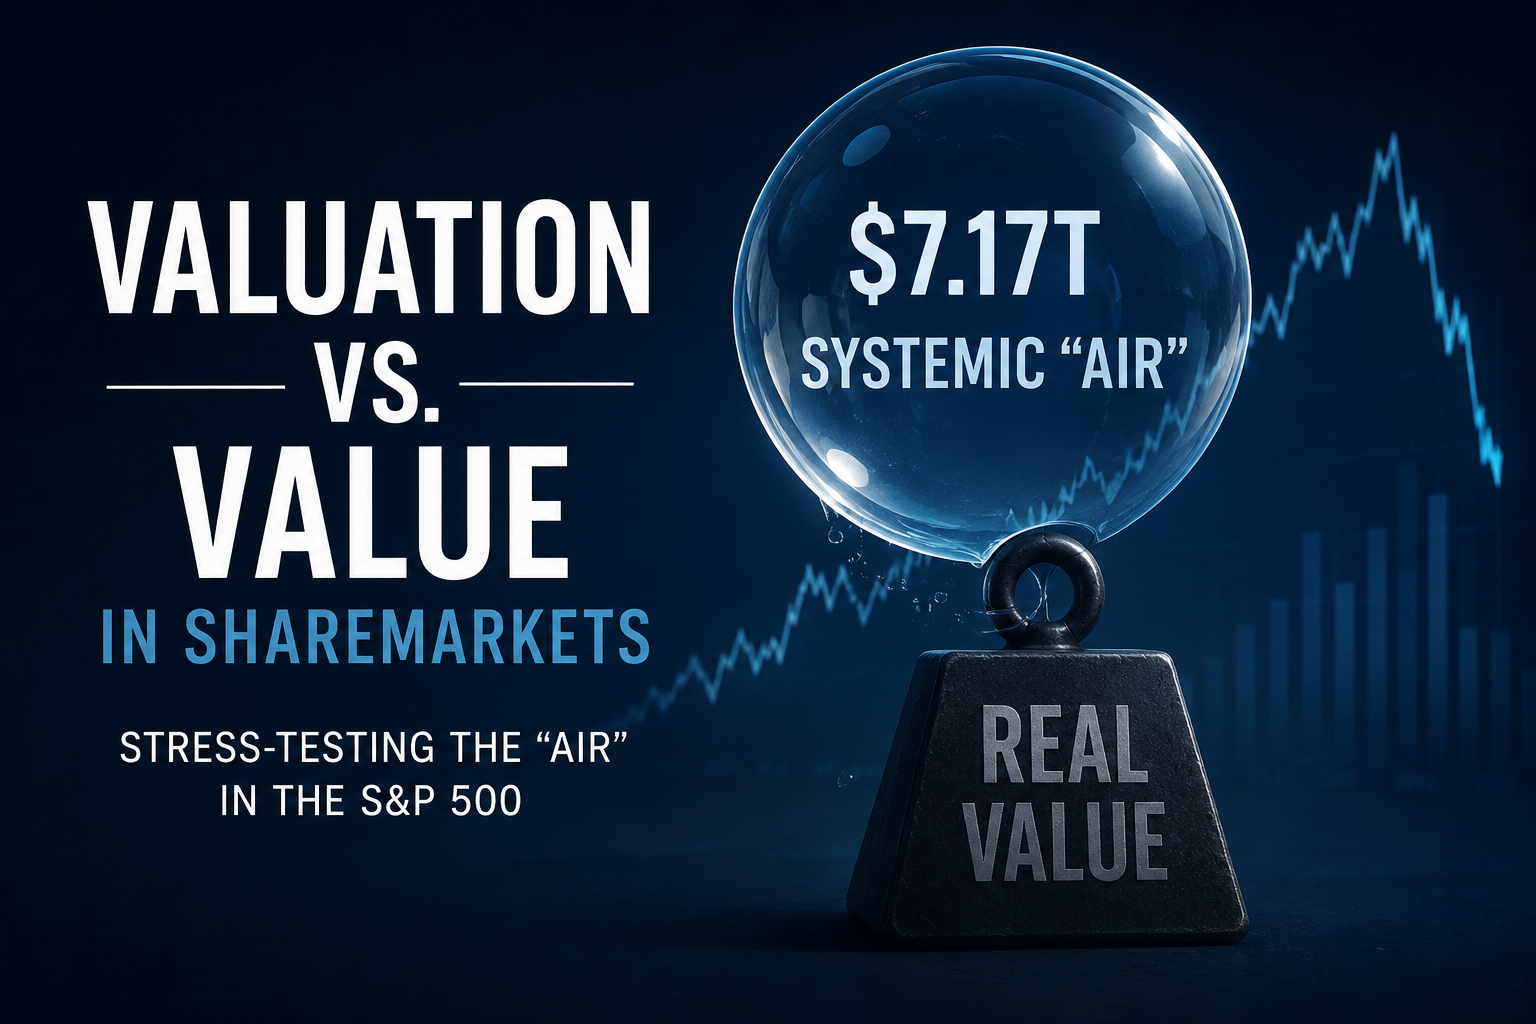
Throughout this article, “Air” is not an accounting term but a shorthand label for valuation premiums that may depend upon assumptions about future profitability.
How the Simulator Operates
The engine runs on three distinct operational parameters, which you can adjust using the interactive sliders:
- Hardware Normalization: Recalibrates hardware champions like Nvidia from their current premium heights back down to premium historic technology manufacturing averages (15x to 50x P/E).
- Hyperscaler Compression: Peels back the valuation premiums of mega-caps like Amazon and Alphabet, letting you simulate a discount for the non-cash paper gains generated by revaluing private startup stakes.
- Pre-Profit Realignment: Stress-tests the multi-billion-dollar Price-to-Sales multiples of unlisted giants like OpenAI and Anthropic before they are formally dropped into capital-weighted consumer portfolios.
What makes this simulator unique for our local context is its built-in dual-currency engine. By instantly translating figures between U.S. Dollars (USD) and Australian Dollars (AUD) at prevailing market baselines (roughly 0.705 AUD/USD), it bridges the gap between late-night American financial headlines and the actual asset allocation choices we face here on the ground.
Please keep in mind at all times that this is just one way of looking at a complex web of factors. The aim is not to suggest that markets are about to ‘crash’, nor is it to suggest that any given company will fail or must follow a particular pathway. It’s just one possible way of looking at the level to which current USA large companies are valued, and how changes in expectations could lead to changes in valuations. Similarly, the initial figures are just starting points and not suggestions or recommendations. The various ‘sliders’ can be moved to whatever levels you think possible or most likely.
S&P 500 Index “Air” Stress-Test Simulator
Adjust the valuation thresholds below to stress-test the structural dependencies embedded inside the capital-weighted U.S. S&P 500 Index.
TOTAL SYSTEMIC “AIR” EXTRACTED
Keeping the Model Honest: Core Deficiencies & Blind Spots
As any financial planner knows, an economic model is only as good as its constraints. To prevent this tool from becoming a blunt instrument, keep these internal boundary lines and counter-points in mind when analyzing the numbers:
- Where the widget might overinflate the "Air" (The Utility Floor): The simulator assumes a synchronized correction across all tech verticals. In reality, hyperscalers own massive, highly profitable legacy software and search monopolies that function as cash-printing utilities. These legacy businesses generate tens of billions in organic cash flow completely separate from AI, which provides a massive structural floor to cushion their stock prices.
- The SAA and Passive Rebalancing Buffer: Standard multiple compression models assume that when a stock cascades, capital flees permanently. However, modern index mechanics dictate the exact opposite. As these mega-caps drop in value, multi-asset funds and institutional mandates tracking rigid Strategic Asset Allocation (SAA) models are legally and algorithmically forced to buy the dip. This programmatic rebalancing back to target growth weights acts as an automated structural bid, directing fresh cash flow into falling mega-caps precisely when their values are dropping.
- The Narrative Premium (The Musk Factor): Traditional valuation frameworks rely on the assumption that markets eventually penalize missed timelines and compressed core margins. Yet, as Tesla has demonstrated for a decade, certain companies command a psychological "shine" that defies standard fundamental gravity. SpaceX and Tesla possess a cult-like retail and institutional devotion. This narrative floor keeps multiples expanded long past standard historical decay rates, a human behavioral quirk that mathematical models systematically underestimate.
- Where the widget might underestimate the structural risk: This model focuses strictly on equity market capitalizations. It completely ignores the corporate debt markets, where mega-cap tech has recently broken records for investment-grade bond issuance to fund their historic infrastructure build-outs. If the underlying commercial revenue cycles stall, the liquidity crunch will transmit through credit spreads far quicker than through equity multiples alone.
Glossary
- Systemic "Air": The portion of a company’s market capitalization or reported net income that is completely unbacked by organic, free-cash-flow-generating customer transactions. Structurally, this "air" is constituted of three primary elements:
- Venture Markups: Non-cash paper accounting adjustments dictated by ASC 321.
- Cloud Credit Round-Tripping: Revenue generated when a hyperscaler funds a startup with server credits, only for the startup to immediately hand those credits back as accounting revenue.
- Multiple Expansion: Speculative premiums added by market participants who apply a premium software multiplier to those non-cash paper gains.
- ASC 321 (US GAAP): A financial accounting standard mandating that public companies recognize unrealized holding gains and losses on private equity securities directly inside their quarterly Net Income statements rather than letting them sit quietly on the balance sheet.
- Hyperscaler: Systemic tech enterprises (primarily Microsoft, Amazon, and Alphabet) that operate global networks of massive data centers and lease cloud compute capabilities at scale.
- Strategic Asset Allocation (SAA): A portfolio management strategy that sets long-term target allocations for various asset classes (e.g., 60% growth, 40% defensive) and systematically rebalances back to those fixed ratios when market movements push the portfolio out of alignment.
Technical Addendum: Index Contraction Methodology
To keep this model mathematically accountable, the "Estimated Global Index Contraction" output is calculated using a standard top-down attribution model based on the following structural criteria:
- The Index Proxy: The simulator targets the U.S. S&P 500 Index as the default benchmark. Because U.S. mega-caps currently dictate more than 70% of the weighting in standard international equity allocations (such as the MSCI World Index), the S&P 500 serves as the most accurate real-world proxy for transmission risk into local diversified portfolios.
- The Baseline Capitalisation: The aggregate market capitalization of the index is locked at a baseline of US$45.00 Trillion (approximately A$63.90 Trillion), reflecting consolidated mid-2026 market values.
- The Mathematical Mechanics: The contraction percentage is a direct function of market-cap weighting. The simulator sums the total dollar value of the "air" extracted across all three tech tiers (the numerator) and divides it by the total index baseline (the denominator):
$$\text{Index Contraction \%} = \left( \frac{\text{Total Multi-Tier 'Air' Extracted (USD)}}{\text{US\$45.00 Trillion (Total Index Base)}} \right) \times 100$$
The Passive Concentration Risk: It is critical to note that a 15.9% index contraction does not imply a broad-based economic recession where all 500 companies decline. Because the index is market-cap weighted, this figure isolates the purely mechanical drag caused by multiple compression among the top 10 to 20 AI-exposed names. The model demonstrates how a valuation correction restricted solely to these tech segments will drop the entire index value by 15.9%, even if the remaining 480 traditional companies in the index trade completely flat.
References & Historical Baselines
- Accounting Frameworks (ASC 321 Valuation Guidance): For comprehensive structural details on how non-cash equity markups hit the income statement, review the official FASB Accounting Standards Update (ASU 2016-01) Financial Instruments Codification.
- Hyperscaler Capital Expenditure Data (As at Q1 2026): For verified institutional tracking of the current US$600+ billion data center investment run-rate across Microsoft, Alphabet, and Amazon, consult the latest Allianz Global Economic Research Tech Capex Tracker.
- Historical Hardware P/E Baselines (Historical Norms Data): The simulator's 18x to 25x historical baseline for mature technology hardware and manufacturing entities is derived from the rolling 20-year median trailing P/E of the S&P 500 Information Technology Index, independently tracked and cross-checked via the Robert Shiller Yale Stock Market Data Archive.
Read this : The Great Disclaimer
Nothing in this Post or on this website is to be considered 'personal financial advice'. That is, this post is not putting forward any level of recommendation of what you should do, nor is it suggesting you should make changes to your investments based on this post or its content. This post relates to general and factual assessments of current financial markets, and then applies a series of assumptions. You need to take these assumptions as guesses - for no matter how much the may be based on research, experience, training or knowledge, they relate to very complex and very fast-moving financial markets across a global market system that is itself immensely complex. And you must take account of the continual possibility of 'being wrong'! Markets have a habit of making fools of those making grand claims. So-called 'bull markets' can remain bullish and highly valued or even over valued for much longer than reason would suggest. Similarly, unknown-unknowns can result in very strange outcomes - an example would be a national government stepping in to nationalise key companies or industries, or offering financial support that cushions otherwise lethal impacts.
There is also the question of portfolios. In any professional portfolio there is an attempt to balance risk and reward. Some people value potential returns/rewards far beyond their concerns about risk. Others take an opposite view. Many more again simply adopt some version of "balanced" approach, which they may or may not measure or benchmark against realistic outcomes. All of these points may mean that none of the points of this post are relevant to you or your position or your financial objectives or needs.
Ideally, seek professional advice and input to any major financial decision.
A website can only be general and factual under the definitions of personal financial advice in Australia. Personal financial advice must be provided under an agreed scope of engagement, relevant disclosure of potential conflicts, disclaimers of limitations of liability, and clarity of that advice meeting your Corporations Act "best interest". None of that can be sufficiently addressed through a general website post.